Performance variables are highly influenced by state policy
Committee to Unleash Prosperity released the
17th edition of “Rich States, Poor States”. The Rich States, Poor States: ALEC-Laffer State Economic Competitiveness Index is a comprehensive report that ranks the economic competitiveness of states using 15 equally weighted policy variables. The American Legislative Exchange Council Chief Economist and Executive VP, Jonathan Williams points out that the bluest and highest tax states are consistently the worst economic performers.
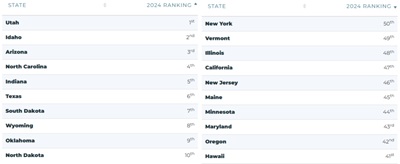
Oregon is currently ranked 42nd in the United States for its economic outlook, moving up one from the last report. This is a forward-looking forecast based on the state’s standing (equal-weighted average) in 15 important state policy variables. Data reflects state and local rates and revenues and any effect of federal deductibility. Oregon's worst and best:
- Ranks 33rd in property tax burden at $30.38/1,000 of personal income, and ranked 3rd in tax expenditure limits, the state’s top position.
- Ranks 49th for top marginal personal income tax rate.
- Ranks 49th for top marginal corporate income tax rate.
- Ranks 49th for personal income tax progressivity.
- Ranks 50th for estate/inheritance tax levied.
- Second top position for Oregon is 10th for average workers’ compensation costs.
- Ranks 18th for the number of full-time equivalent public employees per 10,000 of population (489.1).
The top-heavy government employment is reflected in and the primary cause for the high tax rate.
A D V E R T I S E M E N T

A D V E R T I S E M E N T
Oregon is currently ranked 13th in the United States for its economic performance. The state ranks 25th in debt service as a share of tax revenue. The economic performance rank is a backward-looking measure based on the state’s performance (equal-weighted average) in three important performance variables shown below. These variables are highly influenced by state policy.
- Cumulative GDP Growth, 2012 – 2023 – value 71.31%, ranked 6th, moved up three from last report.
- Cumulative Domestic Migration, 2013 – 2023 – value 221,420, ranked 12th, decreased from last report.
- Non-Farm Employment Growth, 2012 – 2023 – value 18.87%, ranked 14th, remained the same.
The 15 rankings are equally weighted policy variables to determine economic outlook scores. These have been carefully selected as the most important markers of financial stability.
Oregon’s stability policies seem to be tied to rebalancing productivity gains or losses to offset and keep inflation in check. There seems to be no movement to change legislative policies that keep Oregon in the bottom 10.
--Donna Bleiler| Post Date: 2024-04-14 22:16:13 | Last Update: 2024-04-14 23:26:14 |